Workshops & Toolkits
The SDOH & Place Community Toolkit
The SDOH & Place Project Community Toolkit connects equity principles with analysis and design of spatial visualizations for SDOH spatial data. This toolkit draws inspiration from the Robert Wood Johnson Foundation (RWJF) Commission’s findings, which assessed how communities’ health and life expectancy are affected by the places where they live.
.
Intro to R-Spatial for Healthy Places
This suite of tutorials was developed for a workshop at the 2021 R-Medicine Conference by the Healthy Regions & Policies Lab at the University of Chicago, and was also held at the 2022 Society for Epidemiological Research conference. This workbook is a quick (3-hour) overview of mapping, GIScience, and spatial analysis basics for health professionals. The toolkit will continue to be refined at future conferences.
.
Atlas Learn
The US Covid Atlas is a free and open source data visualization platform connecting COVID-19 data and community indicators to better understand the impact of the pandemic, from its start through today. Explore tutorials, video demos, examples of how the Atlas is used in different fields, and more in this toolkit on the basics of spatial analysis in an applied setting.
.
The Opioid Environment Toolkit
This toolkit provides an introduction to GIS and spatial analysis for opioid environment applications that will allow researchers, analysts, and practitioners to support their communities with better data analytics and visualization services. We introduce basic spatial analytic functionalities using open source tools, mainly in R, using applied examples for visualizing, mapping, and understanding the opioid risk environment. This toolkit was given as a series of CME accredited workshops for the Justice Community Opioid Innovation Network (sponsored by NIDA).
Data & Web Applications
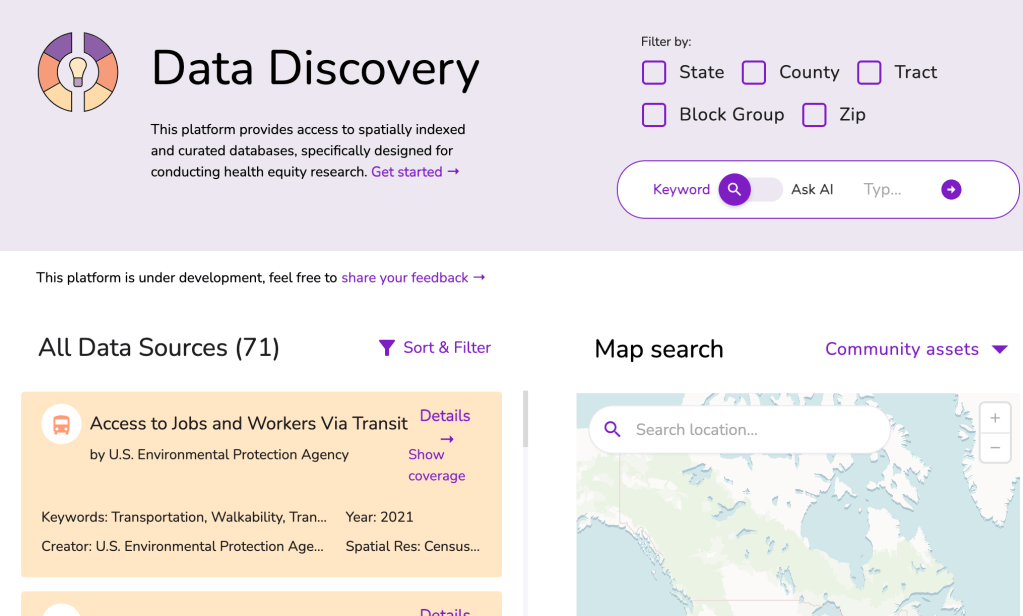
Data Discovery Platform
The Data Discovery platform helps researchers discover, explore, and compare datasets relevant to their research. Users can search across topics, spatial scales, and time periods to identify high-quality data sources for place-based and health equity research.
.
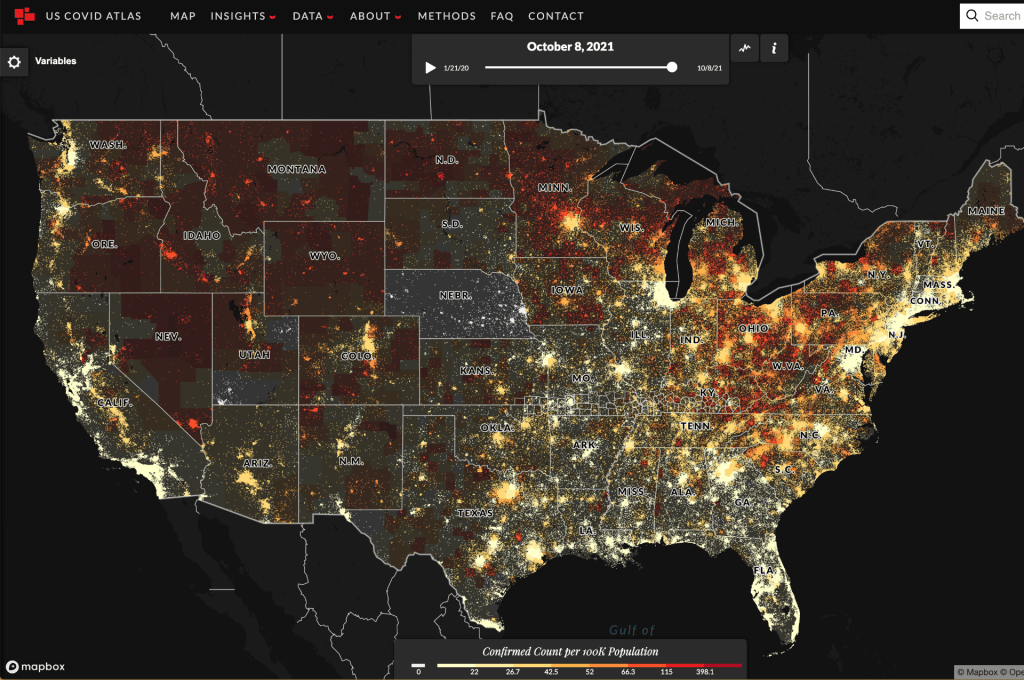
The U.S. Covid Atlas
In a quickly changing pandemic landscape, our tool connects COVID case data and community indicators across the United States from its beginning to today. The Atlas helps you access current, validated county-level data and spatial analysis to better understand the spread in communities and to bolster planning efforts. This project is funded by the Robert Wood Johnson Foundation.
Data: https://uscovidatlas.org/download
.
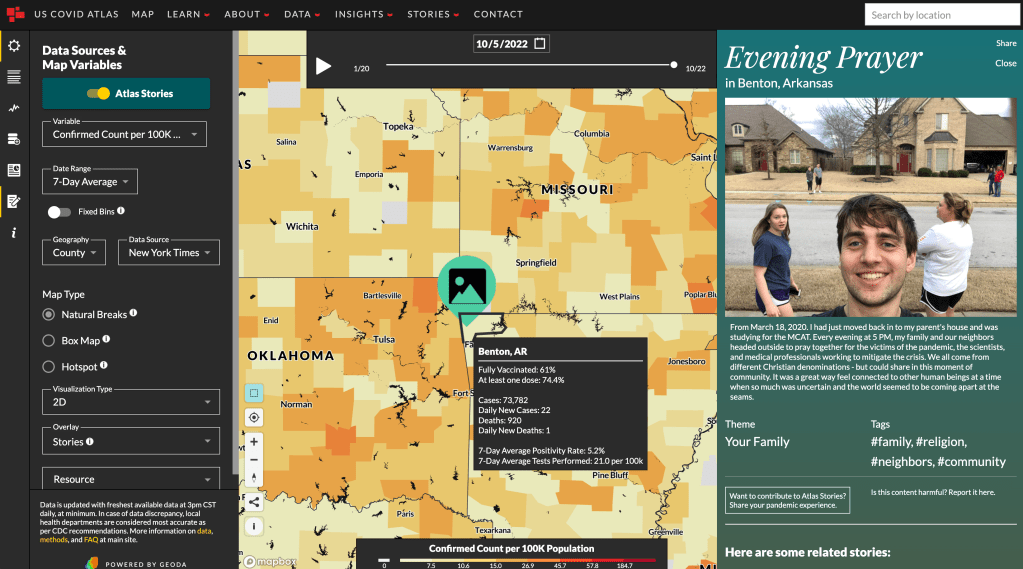
Atlas Stories
The COVID-19 pandemic highlighted community capacity for resilience and inequitable impacts on diverse people and places. This project collects stories behind the statistics and data. We seek perspectives that represent the diversity of experiences in the United States, in order to build a more holistic archive of the pandemic. This project is funded by the Robert Wood Johnson Foundation.
.
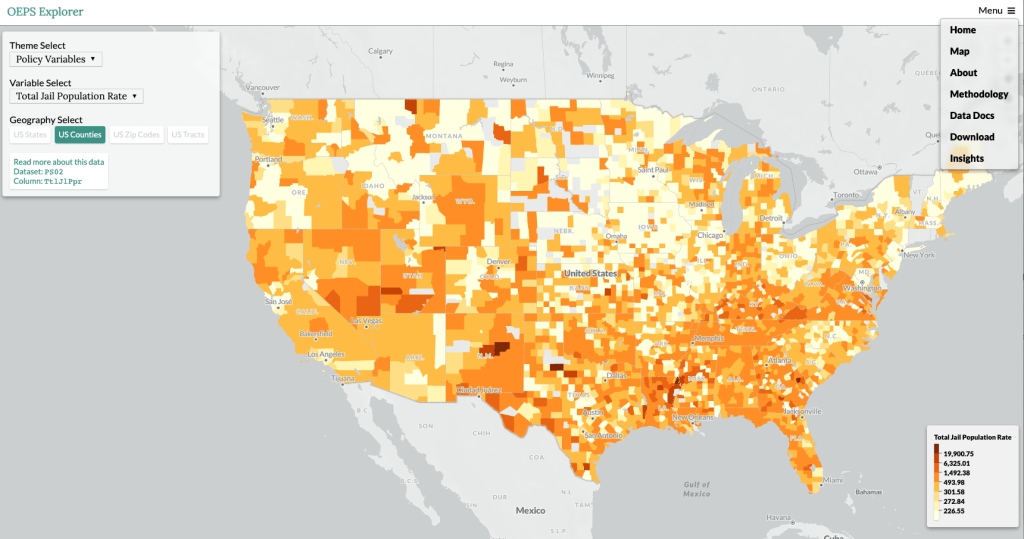
The Opioid Environment & Policy Scan Explorer (OEPS)
An open data warehouse exploring the multi-dimensional risk environment, from neighborhoods to states, impacting opioid use and health outcomes across the United States. This website lets you explore the data at different scales (tract, zip, county, state) before downloading. This project is funded by the National Institute on Drug Abuse.
Data: https://oeps.healthyregions.org/docs and https://oeps.healthyregions.org/download
.
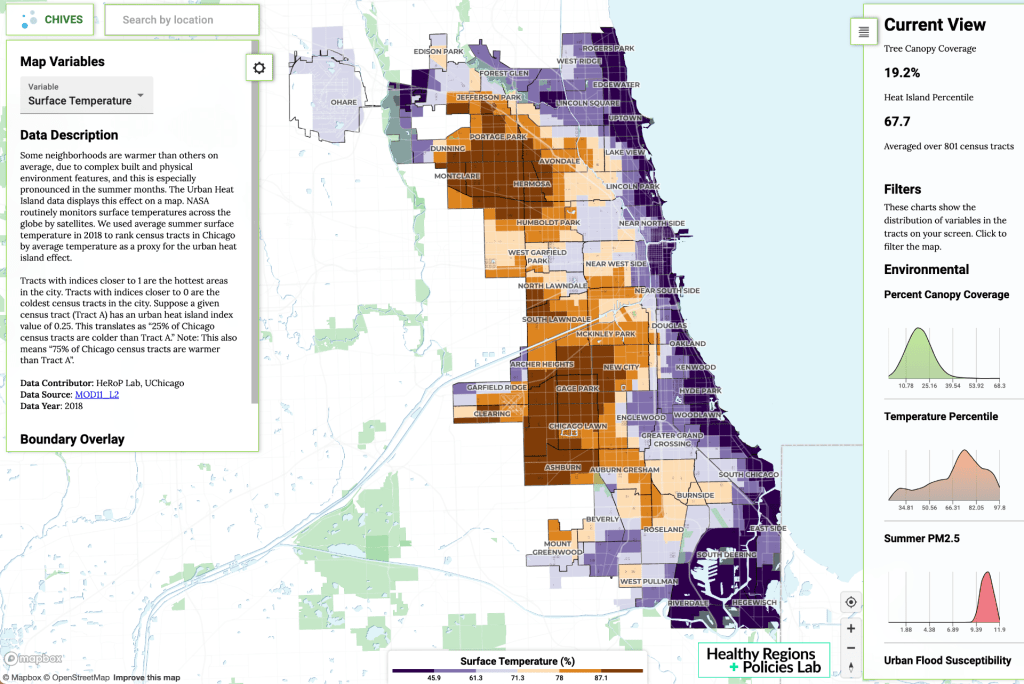
ChiVes: Uncover the nature of Chicago’s environment.
Chicago’s urban environment has profound impacts on the health of communities and individuals. A handful of key metrics―tree cover, air pollution estimates, heat island effects, traffic volumes, and social vulnerability index― help to reveal where in the city people face particular challenges as we work towards a healthier Chicago. ChiVes is a data collaborative and community mapping application that brings data on the city’s environment together.
Data: https://chichives.com/data
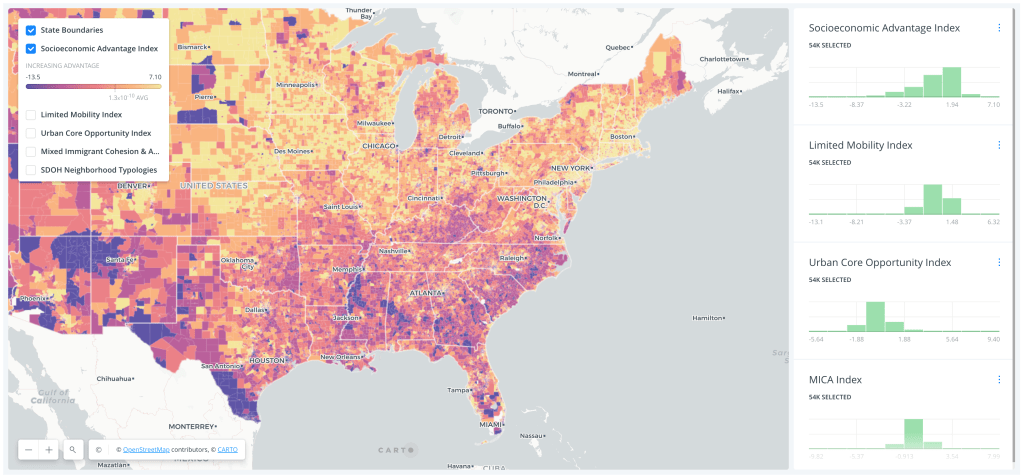
The U.S. Social Determinants of Health
Social Determinants of Health (SDOH) are the conditions in the places where people live, learn, work, and play that affect a wide range of health risks and outcomes. While researchers have long known that socieconomic indicators like poverty and education impact health, it’s less clear why it matters in some places more than others. Our study looked at all the populated census tracts on the United States mainland to look for patterns across fifteen common SDOH indicators. We grouped these as four dimensions of SDOH, and then summarized all tracts as neighborhood types.
Data: https://geodacenter.github.io/data-and-lab/us-sdoh/