Chicago’s urban environment has profound impacts on the health of communities and individuals. A handful of key metrics―tree cover, air pollution estimates, heat island effects, traffic volumes, and social vulnerability index― help to reveal where in the city people face particular challenges as we work towards a healthier Chicago. With an eye toward the sustainable future of our city, the Healthy Regions & Policies Lab (HeRoP) team is proud to share a new initiative this Earth Day.
ChiVes is a data collaborative and community mapping application and brings data on Chicago’s environment together at the neighborhood level. ChiVes harmonizes and standardizes environmental and health data across dozens of sources to make it accessible for full exploration, alongside a growing list of resources on Chicago’s environment, cultivated by a community of curators.
Curious about the name, ChiVes? Like the wild onion that the name “Chicago” was derived from — originally a French rendering of the indigenous Miami-Illinois (Irenwa) word for the plant known today as Allium ticoccum, and more commonly as ramps — we believe data about the city’s environment should be tasty and plentiful. By tasty, we mean easily accessible and ready to use and explore. By plentiful, we mean the data should extend across multiple dimensions of the city, and be updated regularly. Chicago + Visualization = ChiVes, inspired by our city’s history and its natural landscape.
Explore Your Neighborhood’s Environment
Get started exploring ChiVes environmental data in your neighborhood right from the Homepage. On the main homepage, scroll down to the address search box and type in your zip code or address for any area in Chicago.
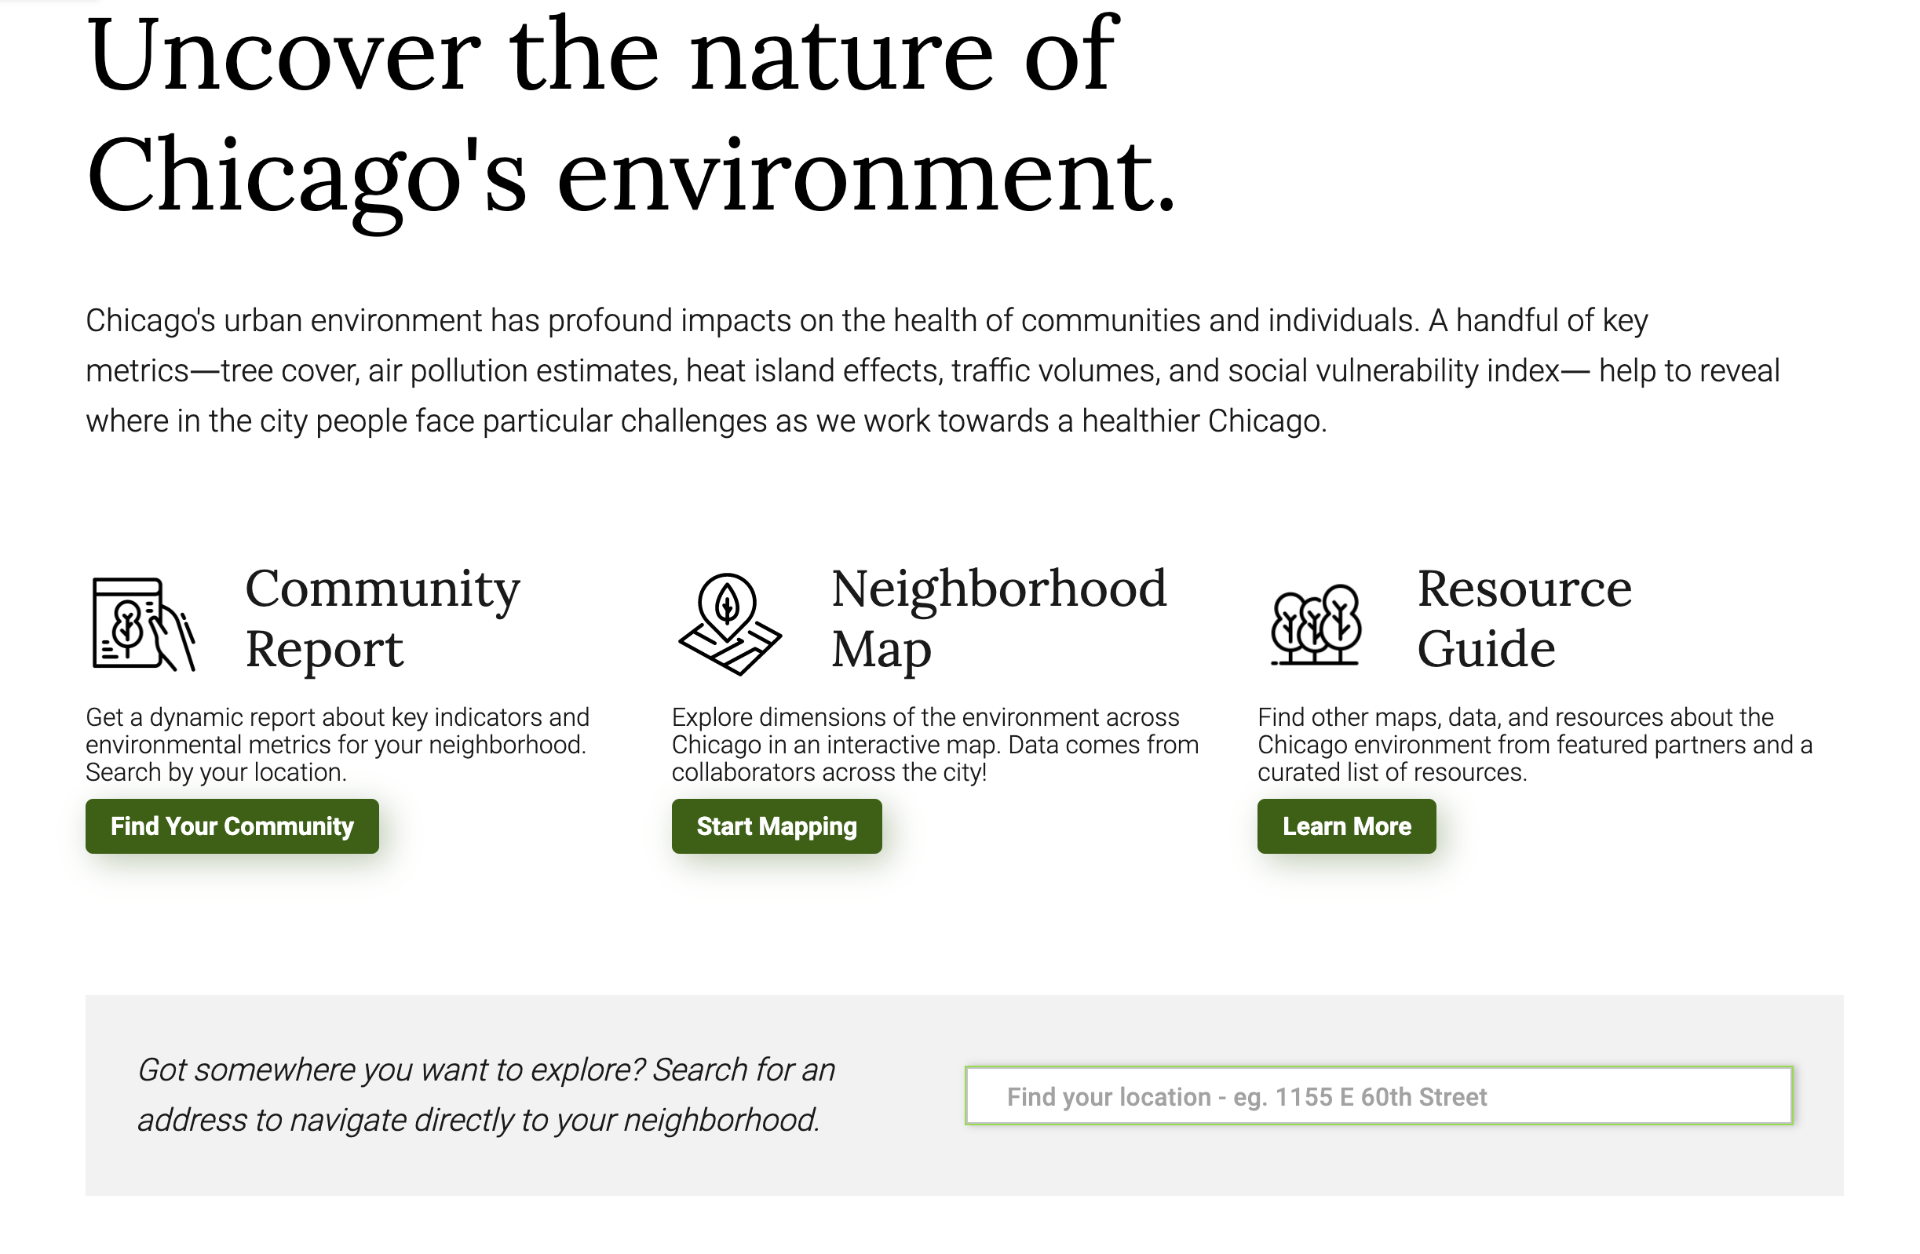
After entering in your address, hit ‘enter’, and you’ll be taken directly to the Neighborhood Map. This is where you can explore your neighborhood or zoom out to other areas of the city to visualize multiple environment-related datasets.
Explore the Neighborhood Map
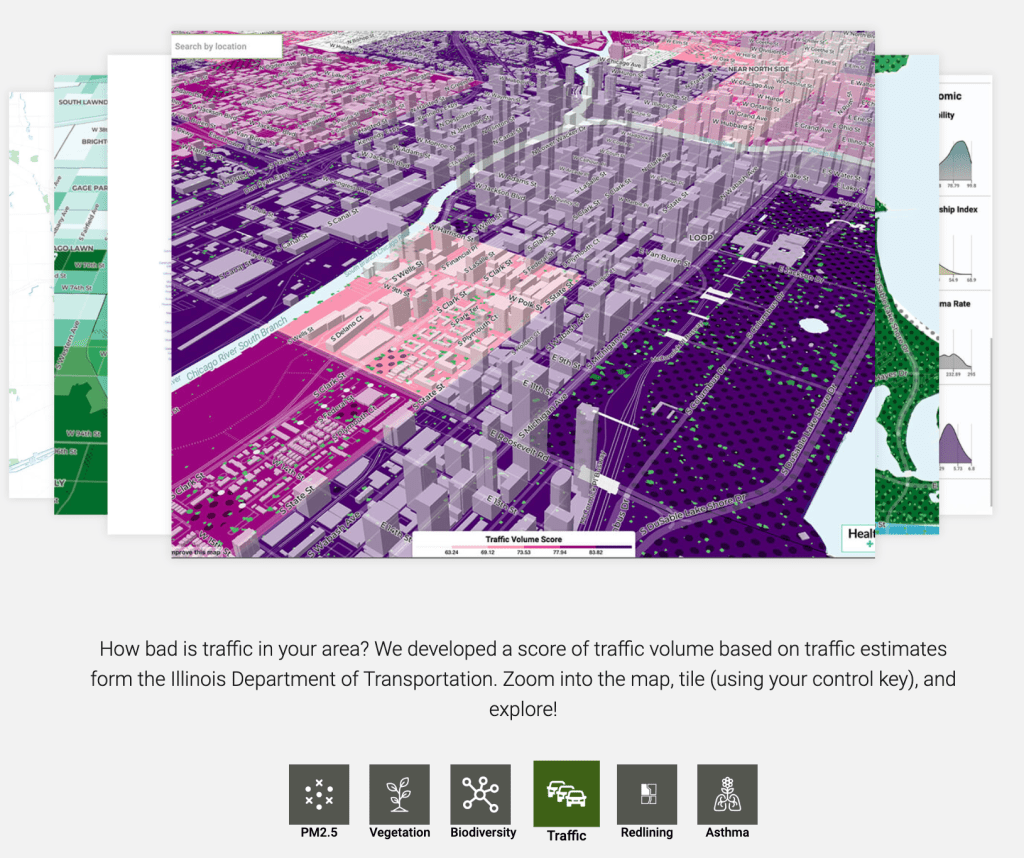
Dive into environmental data at the census tract scale in Chicago with the Neighborhood Map. Once on this page, under the Map Variables panel on the left-hand side, select a variables you’re interested in (i.e. Surface Temperature, Plant Diversity, Traffic Volume) and watch new data appear on the map. You’ll find information about the datasets under Data Description, including its original source, year, and contributor. Scroll down further to select an optional Boundary Overlay, a way to visualize other city or regional boundaries on top of the census tract boundaries, for additional context.
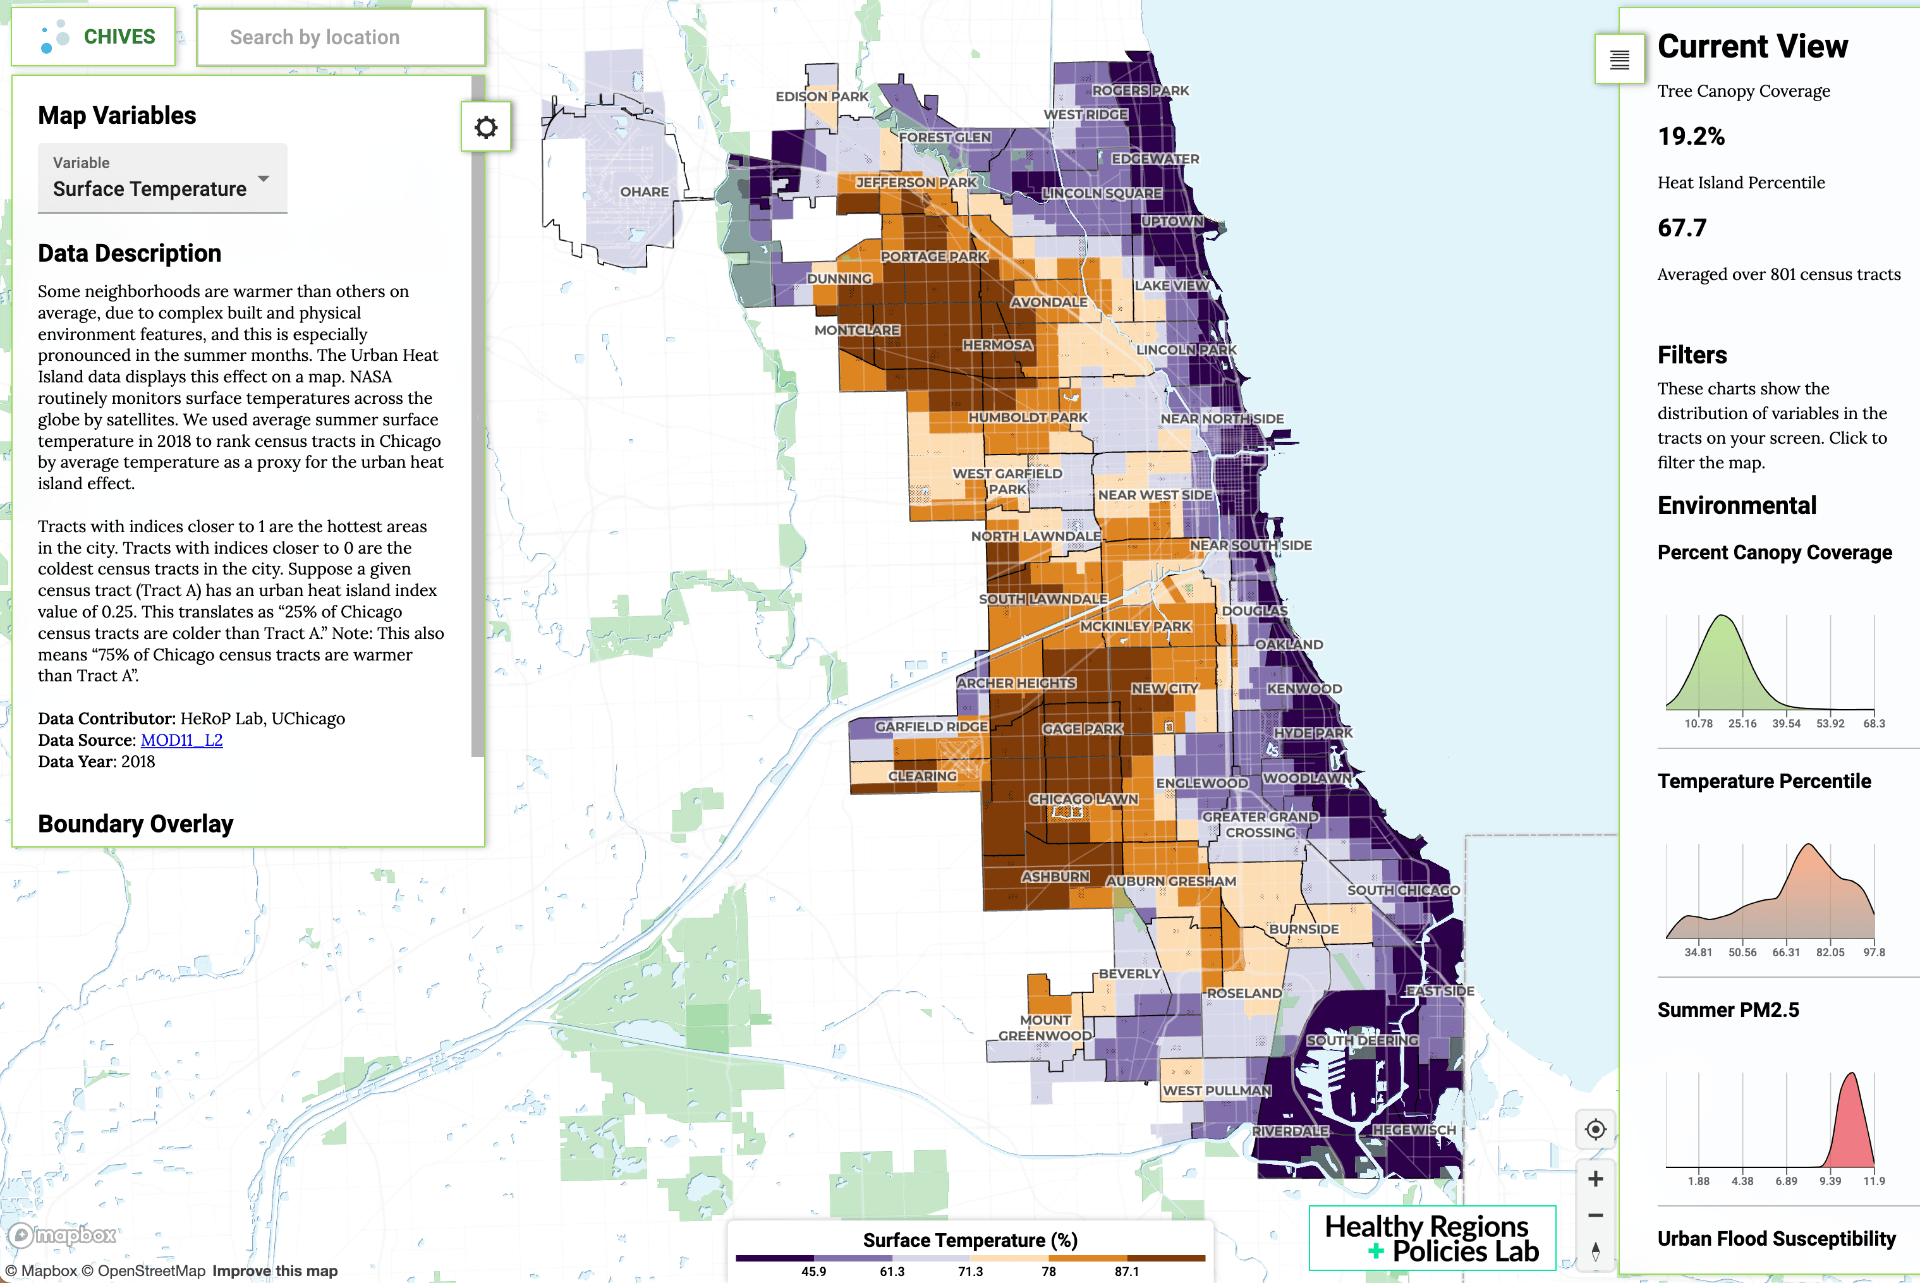
As you zoom in and zoom out on the map, the dynamic data and charts in the right-hand panel titled Current View will adapt. You can click on the bar charts to filter the map for each data interval and explore deeper.
Create Dynamic Community Reports
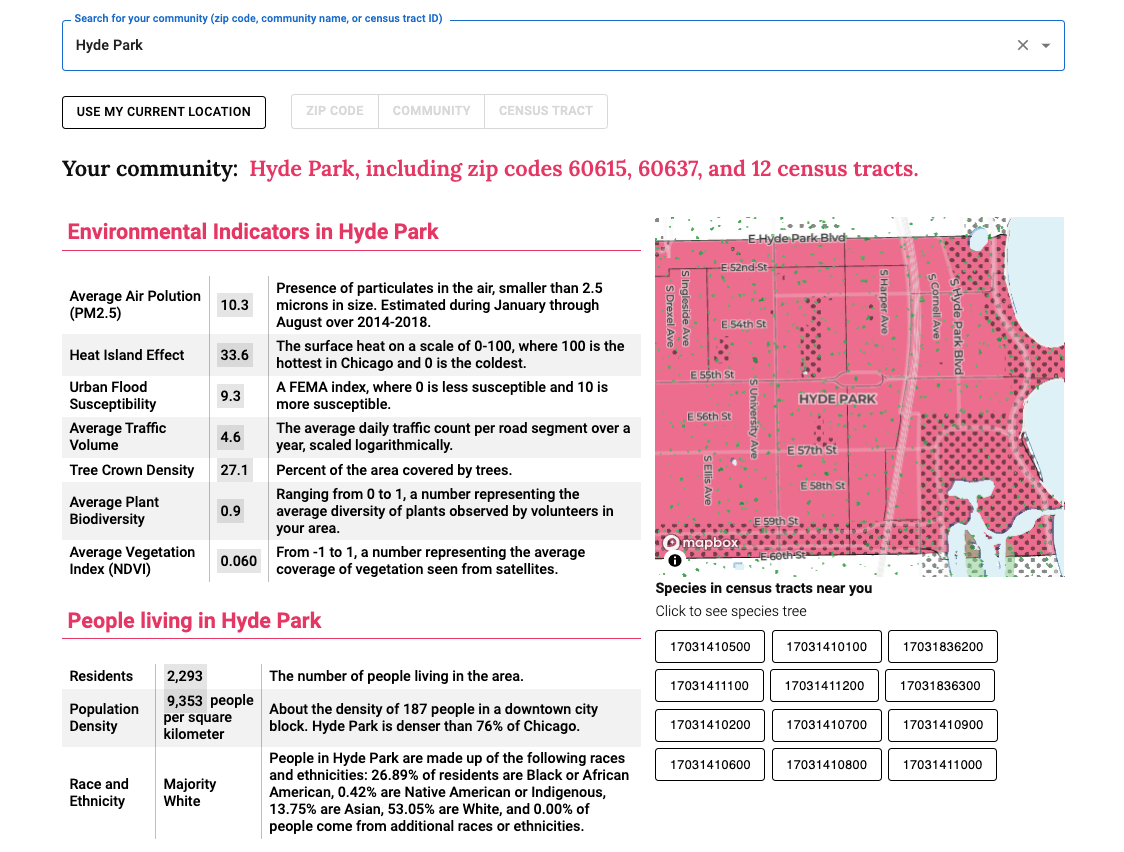
You can also create a Community Report by searching for neighborhood name, zip code, or census tract and discovering key indicators and environmental metrics. The Report makes it easier to share and reproduce metrics with others. You’ll find environmental indicators, demographic information, health outcomes, and social and economic data embedded in these reports.
Learn About Chicago Area Data Resources
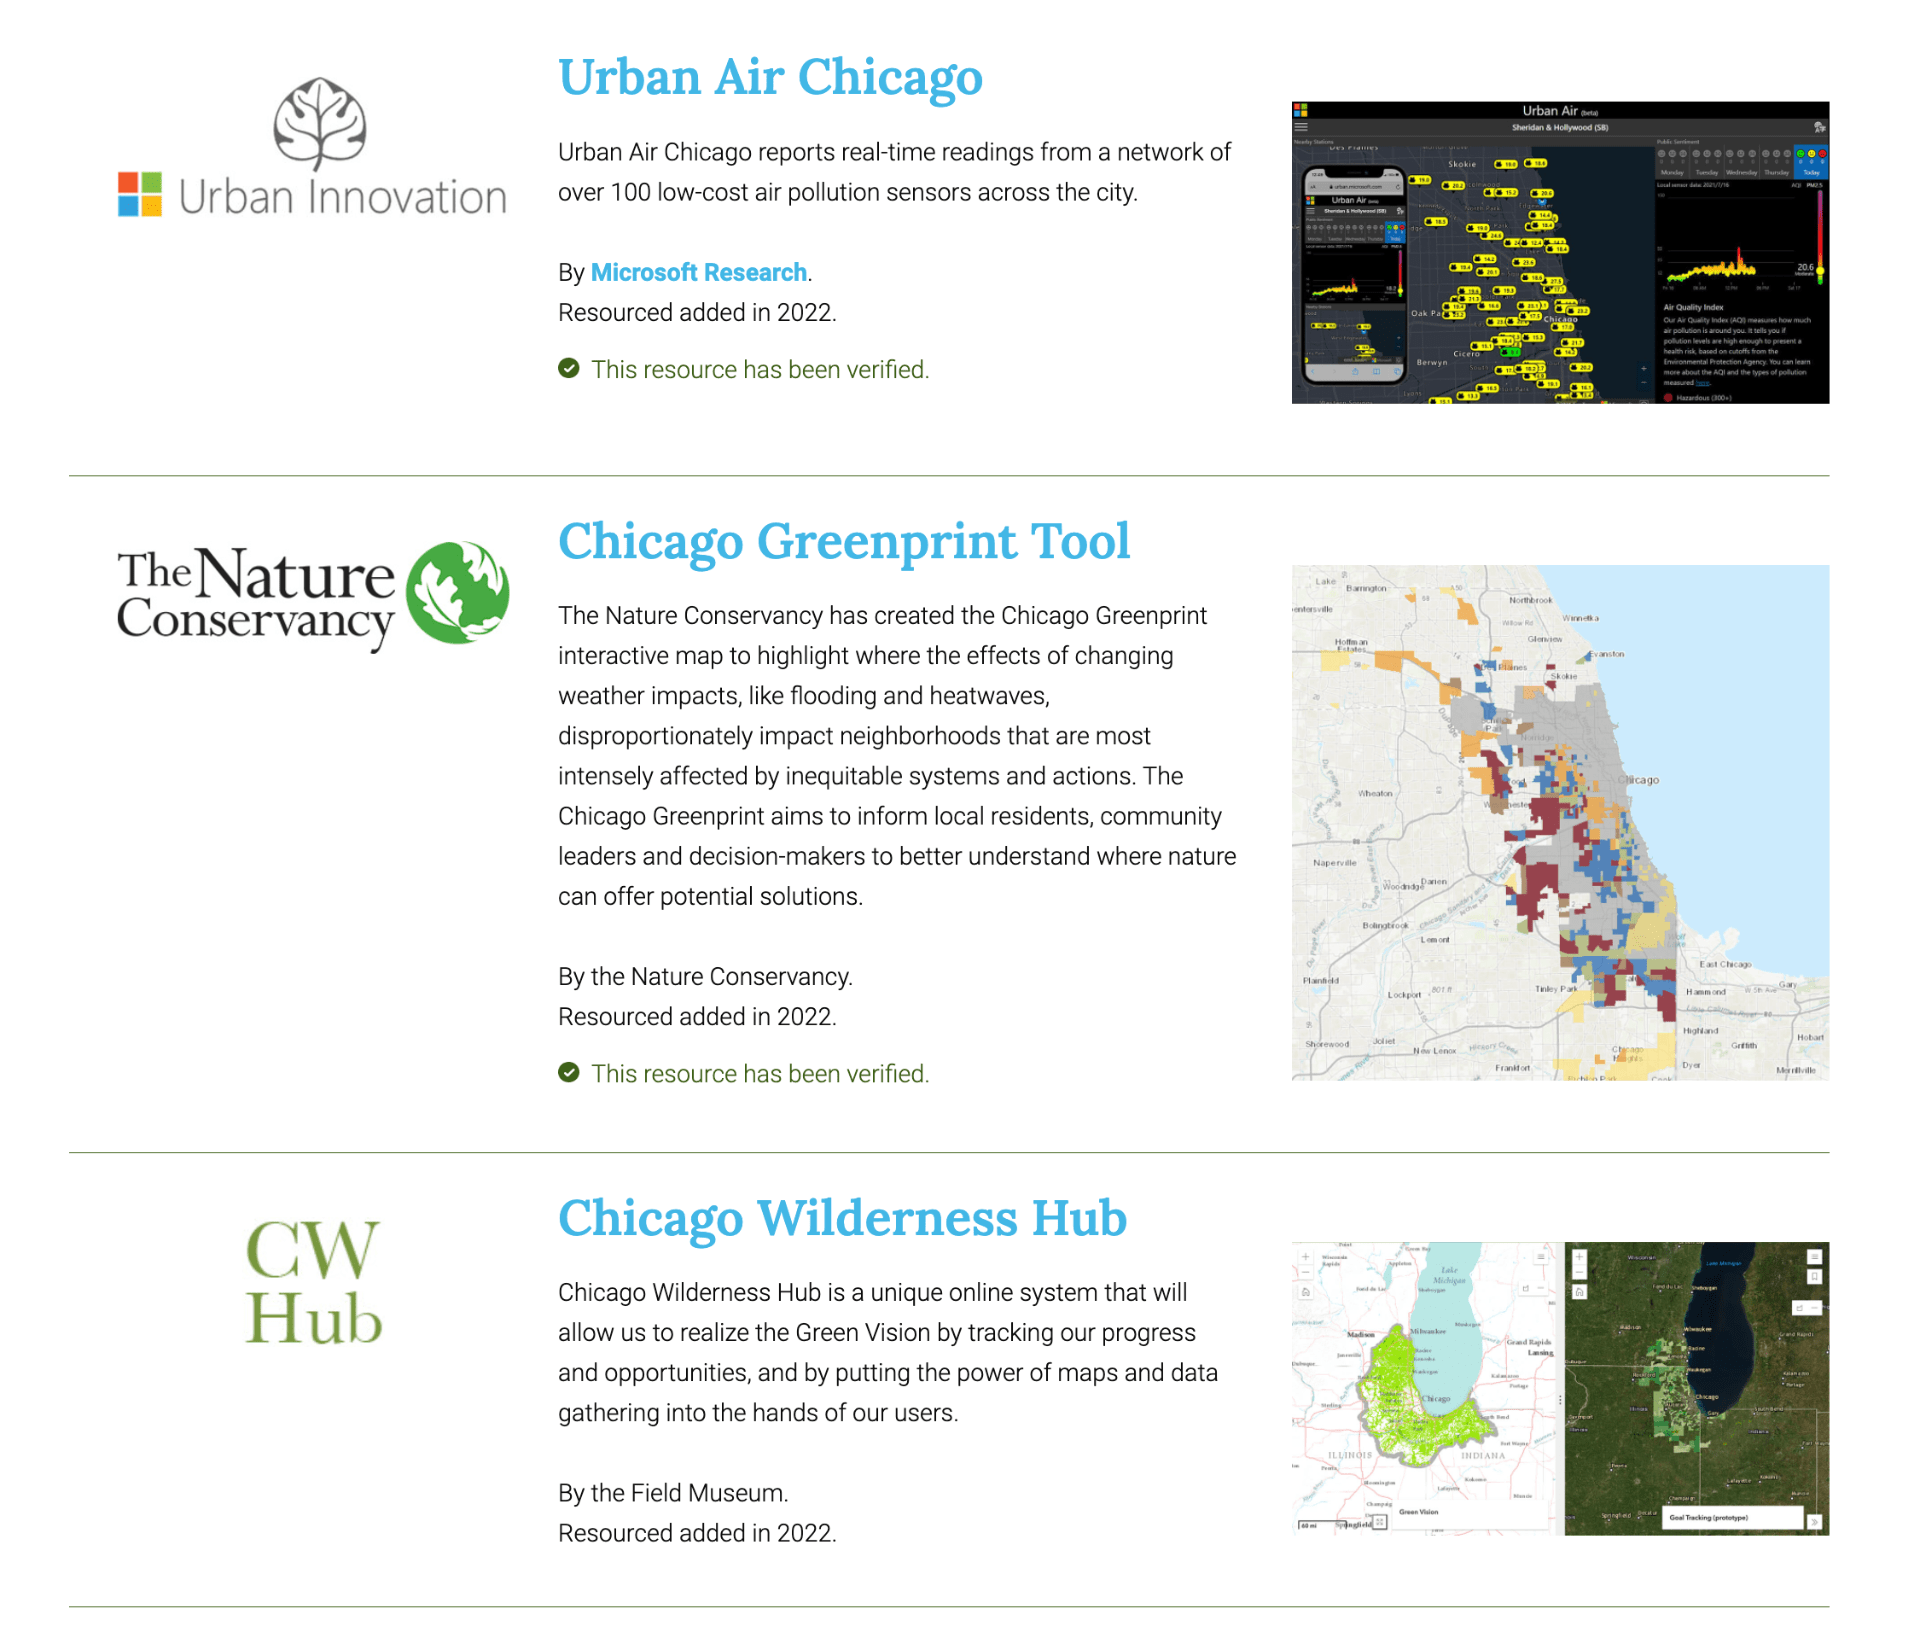
The Resource Guide has additional maps, data, and information about the Chicago environment from featured partners and a curated list of resources. Learn more about projects from Microsoft Research, The Nature Conservancy, Chicago Wilderness Hub, Audubon Great Lakes, and more.
A New Kind of Data Collaborative
We believe collaboration and open science work as critically important to creating equitable and reproducible research. Data is no different. This particular data collaborative approach is designed to help bridge the gap between the research community and local and civic groups involved in environmental efforts.
The ChiVes model reflects these values. Data is added and updated through a collaborative partnership of researchers, community organizations, and civic groups. We’re proud to have an interdisciplinary group of community partners involved in this pilot stage and look forward to additional collaborations as we grow
The Data Collaborative provides insight, direction, and relevant environmental data to the Chicago community. The group advises on ChiVes data standards and needs, and includes the following members (* indicates Current Leadership):
- Zac Adelman, Lake Michigan Air Directors Consortium
- Elsa Anderson & Sophie Taddeo, Chicago Botanic Gardens
- Madeleine Daepp, Microsoft Research
- Tiffany Werner, Environmental Law & Policy Center
- Anne Dodge, Mansueto Institute, University of Chicago
- Jim Franke & Haynes Stephens, Department of Geophysical Sciences, University of Chicago
- Anastasia (Stacy) Montgomery, Sara Camilleri & Dan Horton, Climate Change Research Group, Northwestern University
- Michelle Stuhlmacher, Department of Geography, DePaul University
- James Keane, *Dylan Halpern, *Marynia Kolak, & *Susan Paykin, Healthy Regions & Policies Lab, Center for Spatial Data Science, University of Chicago
We are also grateful to the Nature Conservancy, Audubon Society, and Field Museum for their insights and support.
For more information, please visit our About page.
Get Involved, Join the Collaborative
Do you have data to add? A mapping resource to share or recommend? Organizations and individuals can participate in ChiVes in multiple ways:
- Data Collaborative. Integrate your data directly. Members agree that the final, integrated data will meet Collaborative standards.
- Resource Guide. Share your web-based or print media resource on the Chicago environment. Resources must meet ChiVes standards.
- Web Development. Developers and code-enthusiasts can fork the ChiVes website, make changes, and submit for review.
View the Standards and Submission Guidelines for more information on what kind of data we look for.
We’re excited to grow the ChiVes community and welcome your participation and feedback.
Contact the ChiVes project leadership team directly through this Contact Form, or tweet us at @HealthyRegions. We look forward to growing this project and expanding access to environmental data in Chicago. Happy Earth Day!
