
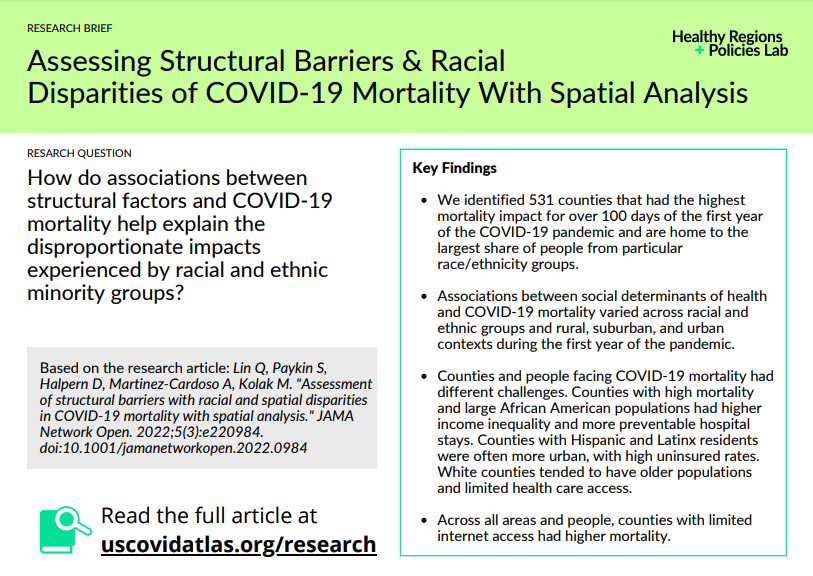
COVID-19 highlights disparities in healthcare access & challenges facing US counties. Our team’s article in JAMA Network Open identifies relationships between structural barriers & racial/ethnic disparities of COVID mortality using spatial analysis.
Data for the whole country available by race and age is at the regional scale – not every state provides race and age disaggregated data. This data suggests spatial variation, different regions are seeing different outcomes, and disparities for working age folks in particular.
We fill the gaps by identifying 1) where people tend to live and 2) what COVID-19 impact has been like for those counties. This is called co-location mapping. We started by drawing dot density maps, where each dot represents 120 people, and overlaying that with COVID-19 data.
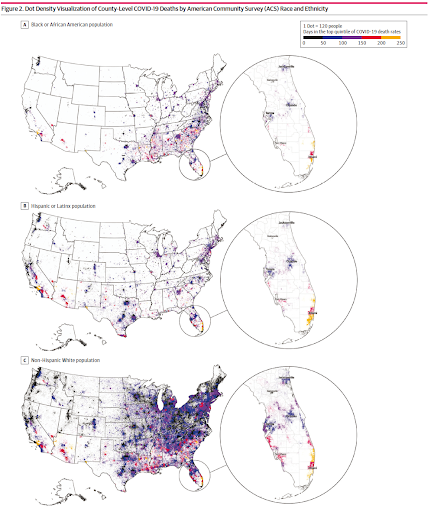
The specific measure we’re using for COVID-19 impact is the days in the first year of the pandemic where a given county was in the top 20% of counties for COVID-19 per capita mortality. The most impacted counties spent more than 200 days experiencing this level of mortality.
Here’s that measure on a map, highlighted by counties with shares of population in the top quintile of race/ethnicity for Black or African American, Hispanic or Latinx, and non-Hispanic White populations.
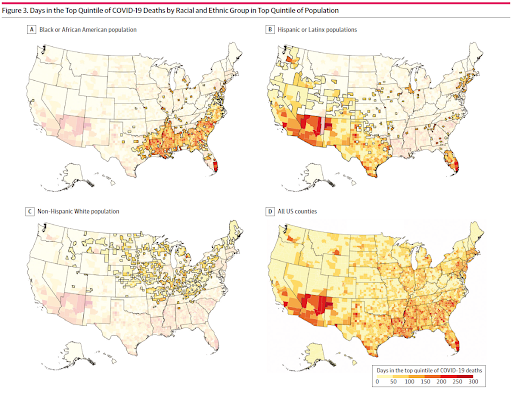
We called counties that had the largest share of a race or ethnicity group and also spent more than 100 days experiencing the top quintile of COVID-19 mortality as concentrated longitudinal impact county, or CLI county for short.
Using these counties, we analyzed structural factors that may relate to a more severe experience of COVID-19. First, we analyzed some environmental factors like how urban or rural counties tended to be, access to healthcare and the internet.
A few composite #SDOH indices that reflect socioeconomic advantage, mobility, opportunities, and cohesion, and a policy variable that captures how quickly the county enacted a mask mandate. Here’s what we found:
First, associations between #SDOH and COVID mortality varied across racial & ethnic groups and rural, suburban, and urban contexts during the first yr of the pandemic. Across the US, counties and people facing COVID mortality had markedly different challenges.
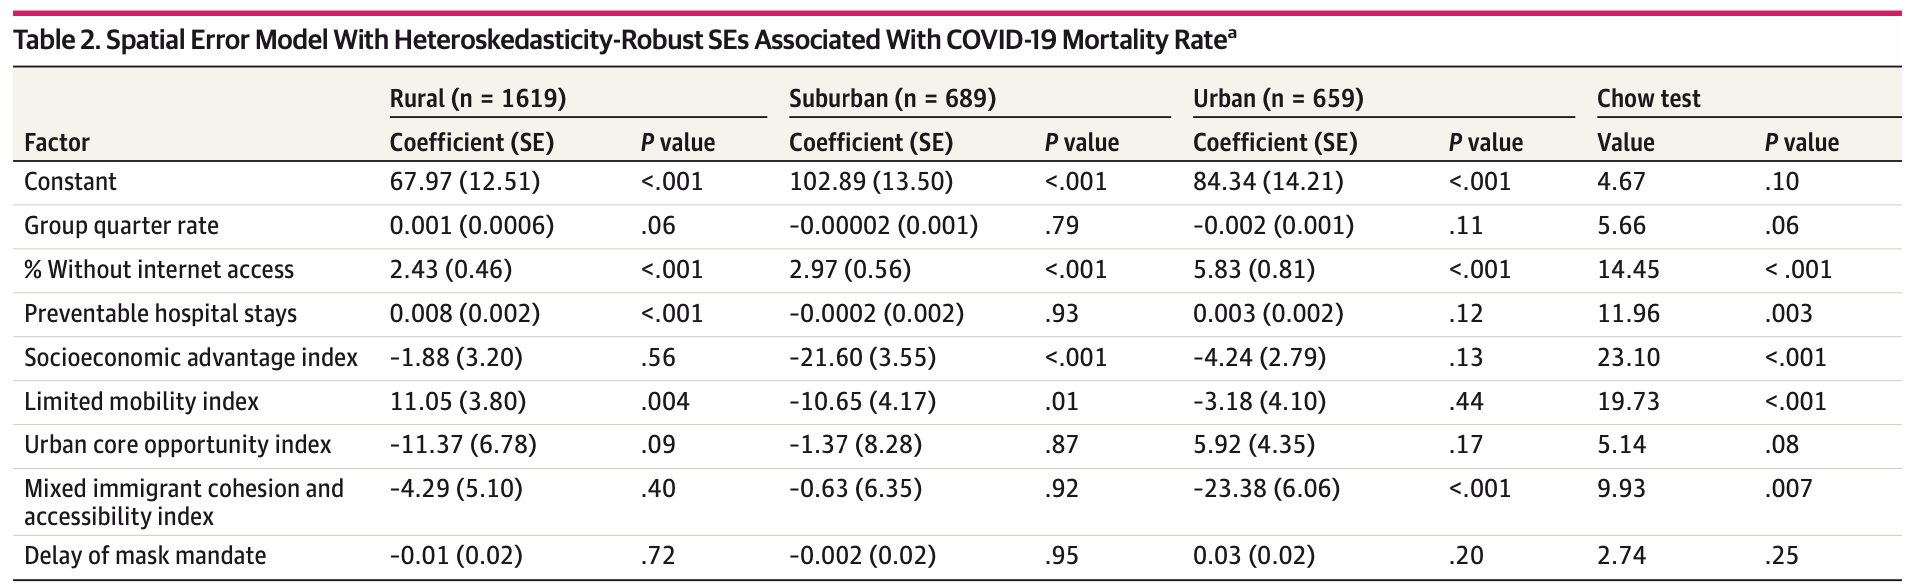
Counties with high mortality & large African American populations had more income inequality and more preventable hospital stays. Counties with Hispanic/Latinx people were more urban, w/ high uninsured rates. White counties had older populations & limited health care access.
Across all areas and people, counties with limited internet access had higher mortality. When internet connectivity is a lifeline for telehealth, ordering groceries, education, and family connections, it isn’t surprising that access to the web appeared central.
Particularly for Hispanic and Latinx communities, our findings supported previous research that found elevated risk associated with work requirements and concern about going to a hospital because of the financial burden or immigration concerns.
Heavily overrepresented in frontline essential jobs, many in the Black community are left without the resources that allow them to stay home or stay safe face greater risk of COVID.
A smaller portion of the White population as compared to Hispanic and Black or African American populations experienced high COVID mortality rates.
If you want to read more about our article, see our research brief here: uscovidatlas.org/research-brief And our blog post here: medium.com/covidatlas/ass
Read the full open-access (no paywall) article on @JAMANetworkOpen here: jamanetwork.com/journals/jaman
A huge thanks to authors Qinyun Lin, Susan Paykin, Dylan Halpern, Aresha Martinez-Cardoso, and Marynia Kolak. This study was part of the @covid_atlas project, funded in part by @RWJF – thank you to our funders and partners for enabling this study and our continued research.
