By Anastasia Montgomery, PhD Candidate, Northwestern University
Anastasia is a PhD Candidate at Northwestern University in the Department of Earth and Planetary Sciences. Her research focuses on the interplay between air quality and climate change, integrating data science principles to analyze observational and simulated datasets. HEROP was thrilled to collaborate with Anastasia this summer this summer on a short citizen science air quality project.
In the United States, the gold standard of air quality monitoring comes from the Environmental Protection Agency (EPA), as these sensors are calibrated, maintained, and used for regulatory purposes. The drawback of these sensors come from their scarcity — of the 3006 counties in the US, only 1147 report annual concentrations of 1 or more regulated pollutants. Even within a single county, air quality hotspots can be routinely missed due to monitor placement. To fill in the gaps of air quality monitoring, communities turn to low-cost air quality sensors. These sensors typically have lower accuracy and a higher bias compared to EPA sensors, but these low-cost monitors provide relevant insight on the spatial heterogeneity in pollutant concentrations. With further development into low-cost, internet enabled devices, smaller networks of air quality monitoring equipment have begun to pop up to provide easy-to-access information for communities and scientists alike.
The PurpleAir air quality monitoring network takes advantage of the latest developments in low-cost sensing technologies. Since 2015, this project has provided real-time particulate matter (PM) concentrations using volunteer-led installments. Each sensor costs around $250, which has brought these sensors into the hands of community groups and individuals interested in local air quality monitoring. The volunteer may choose to connect their PurpleAir to the internet for public consumption, in which data can be retrieved via an interactive map. As a result, this network contains hundreds of low-cost sensors which can supplement EPA measurements of PM. Specifically, we’ll focus on PM2.5, which are the ultra-fine particles that can cause lung and heart disease.
In this project, we use the PurpleAir network to identify PM2.5 hotspots across a 21-County area, and then dive deeper into Chicago’s county, Cook County, over the course of the year 2020. The 21 county-area of interest is shown in Fig. 1, where 44 PurpleAir sensors supplement the 30 EPA monitors. After filtering for missing data and data quality, only 23 PurpleAir sensors reported reasonable data (Fig. 1). The bulk of these sensors are found in Cook county, where there are 10 EPA monitors and 6 PurpleAir stations.
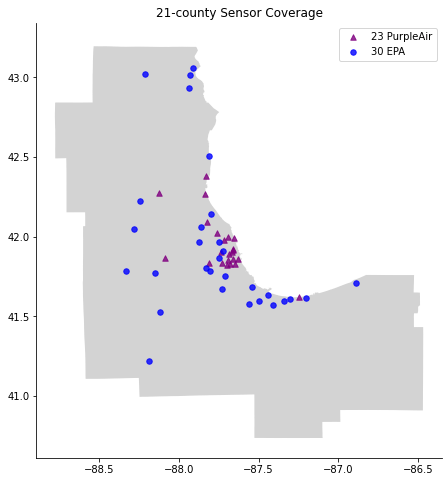
Fig 1. The location of 23 PurpleAir and 30 EPA stations over the 21-county area used in this analysis.
To identify the relative agreement of the PurpleAir and EPA measurements, we analyzed the daily average concentrations of the PurpleAir sensors to EPA measurements. Due to the high sampling rate of the instruments, PurpleAir provides PM2.5 concentrations at 10-minute, 30-minute, 60-minute, daily, and weekly average time intervals. The EPA reports PM2.5 concentrations by 24-hour averages. As a result, we can constrain what is considered a “reasonable” measurement by using the 24-hour averages reported by the EPA. From Fig. 2, we show that the 23 PurpleAir monitors show reasonable performance in aggregate when compared to the 30 EPA stations over our 21-county area. Here, we show that PurpleAir sensors have on average higher (+4 μg/m3) readings than the EPA sensors within the 21-county area, but general cyclical trends are captured. Previous studies have noted that PurpleAir monitors tend to have higher-than-average concentrations of PM2.5 when compared to EPA standardized sensors (Barkjohn et al., 2020; Tryner et al., 2020; Wallace et al., 2021).
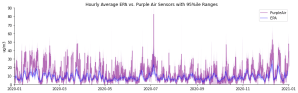
Fig 2. The 21-county average values, with EPA in blue and PurpleAir in purple.
Within the 21-county area, there exist no collocated PurpleAir and EPA sensors. As such, identifying the exact relationship between the two sensors is impossible. The 2 closest EPA and PurpleAir sensors exist within Chicago, about 1 mile apart in the Humboldt Park neighborhood (Fig. 3). The PurpleAir sensor is situated near a busy road and a metal supplier. In contrast, the EPA station is located near a railway intersection and a park. From the preliminary analysis of PM2.5 concentrations, it is unsurprising to see that the PurpleAir station reports higher levels of PM2.5. However, direct comparison of these two sensors are further complicated by the measurement sampling rate and placement standards. Surprisingly, the EPA station at the Springfield Avenue Pumping station reports fewer daily measurements (49 days) compared to PurpleAir sensor (227 days). According to the EPA Ambient Air Monitoring Plan of 2020, the EPA sensor at this location should be providing hourly samples of PM2.5. Instead, the data reported from this station is output erratically (every week or so), so a finer-scale temporal analysis at these locations is impossible. Regardless, on the days that there are measurements from the EPA station and PurpleAir sensor, the PurpleAir sensor reports (14.45 μg/m3) higher levels of PM2.5 when compared to the EPA measurement (8.37 μg/m3). As a result, this exercise is inconclusive as to whether the difference in concentration of PM2.5 within this neighborhood is significantly different, or if the purple air sensor continues to display high bias. This could be further examined by recalibrating the PurpleAir measurements similar to Barkjohn et al., 2020, or by collocating sensors.

Fig 3. The location of the EPA monitor at Springfield Avenue Pumping Station (epa1) and PurpleAir sensor (purp1), mapped using Google Maps.
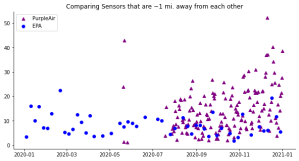
Fig 4. Comparing the 24-hour measurements of PM2.5 over 2020 with an EPA (blue circle) and PurpleAir (purple triangle) sensors.
Understanding that the PurpleAir sensors tend to be biased with higher readings, we can tentatively investigate the PurpleAir coverage by asking neighborhood-specific questions. Mainly, we can explore how these sensors perform given our current EPA standards, and highlight the heterogeneous exposure to PM2.5. Within Chicago, unequal health outcomes related to environmental conditions contribute to the 9-year life expectancy gap between Black and white residents of the city (CDPH, 2020). By analyzing these sensors as if they were EPA monitors, we can investigate how well our city and 21-county area performs at the sub-neighborhood scale. According to the EPA, Chicago is within PM2.5 attainment levels (IEPA, 2020). However, the PurpleAir network identifies 502 additional hours that would trigger a poor air quality alert (where PM2.5 concentrations exceed 50 μg/m3, Fig. 5a). Additionally, with a simple application of the 24-hour standard of 35 μg/m3, there are 10 sensors with over 5 days above this daily standard (Fig. 5b). After calculating the annual average of each PurpleAir sensor, we see 14 PurpleAir sensors reporting annual averages above the 12 μg/m3 standard (Fig. 5c).
A caveat for this analysis is that the EPA standards consider the 98th percentile of 24-hour PM2.5 concentrations in one year, averaged over three years. In other words, the EPA standards do not consider the highest values of PM2.5 to set their standards, and these standards can only be violated with 3 years of data. To contrast, this analysis only looked at one year of data, without excluding reasonable, elevated values. However, this analysis indicates that average PM2.5 concentrations across the 21-county area are high enough to trigger potential air quality warnings in areas where PM2.5 is otherwise unmonitored.
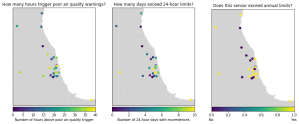
Fig 5. By using EPA thresholds, we color each PurpleAir sensor locations with the (a) number of hours above the poor air quality (50 μg/m3 ) trigger, (b) the number of days above the 24-hour threshold (35 μg/m3) and (c) the stations which are above (yellow) or bellow (purple) the annual average standard (12 μg/m3).
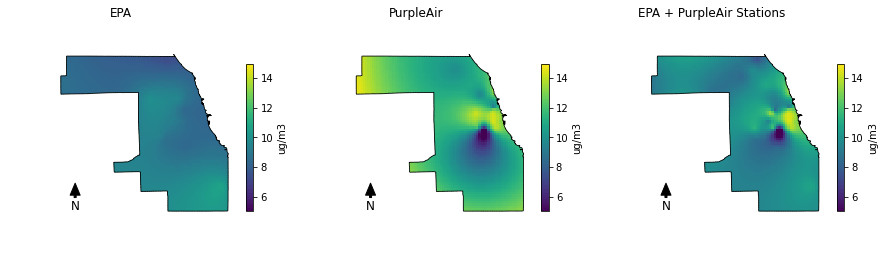
As a final test of the utility of the PurpleAir datasets, we can look at the spatial information provided by the monitors by interpolating the annual average station measurements. In Fig. 6, we show the 21-county area with the interpolated measurements from the (a) EPA, (b) PurpleAir and (c) both sensors. Interpolation is a technique that estimates data given a range of values from a discrete set of observations. In this example, our stations report PM2.5 concentration (a.k.a., discrete observations), with which we estimate the PM2.5 concentrations between stations (a.k.a., we create new data) by taking the average of the nearest stations. The EPA map shows lower values than the PurpleAir maps, and the PurpleAir map has a halo-effect of high measurements due to high measurements at the edges of the interpolation domain. This halo highlights the potential errors in interpolating station-maps, particularly when data is scarce over large areas. When combining the two datasets, the maps show far greater spatial heterogeneity in concentrations. In particular, the combined datasets show the high PM2.5 concentrations around the center of Chicago, where large sources of emissions are located.
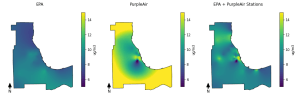
Fig 6. Annual average concentrations of PM2.5 over the 21-county area interpolated from (a) EPA measurements, (b) PurpleAir measurements, and (c) the combined datasets.
In Fig. 7 (below), we focus on the interpolated station-map of Cook County, where the bulk of the monitors are located. Similar to the 21-county domain, the EPA-specific map shows little spatial heterogeneity in measurements values across the Cook county domain, and the PurpleAir sensors display higher concentrations of PM2.5. The combined map concentrations high-levels of PM2.5 within Chicago and near the lakefront, where high emissions and high-density populations interact. The dark spot within the PurpleAir map indicates a potentially erroneously low sensor measurement that was not caught within preliminary data cleaning. From these maps, we show that PurpleAir does provide some additional information on pollution patterns within Cook county and the 21-county area.

Fig. 7 Annual average concentrations of PM2.5 over the Cook County interpolated from (a) EPA measurements, (b) PurpleAir measurements, and (c) the combined datasets.
In locations without any monitoring, it’s difficult to ascertain the true levels of pollution, but the PurpleAir sensors seem to give reasonable information on areas lacking in other evidence. In conclusion, the PurpleAir sensors can provide additional information on PM2.5 concentrations within our urban environment, but these measurements are typically higher than reported EPA concentrations and require additional processing for data cleaning. As a supplemental tool to the EPA monitoring network, we have shown that PurpleAir monitors do highlight the varying pollution levels that exist within our environment at levels that are not monitored by the EPA. Additional fidelity can be granted to this dataset with further re-calibration, colocation, and cross-analysis with other datasets.
Notes
This project would not have been possible without several Python open-source libraries. The figures were made using Matplotlib, the map projections used Cartopy, the shapefiles were manipulated using Geopandas and Shapely, and the mathematical calculations were made using Numpy and Scipy. The Python code is available on Github.
References
- Barkjohn, Karoline K., et al. “Development and Application of a United States-Wide Correction for PM2.5 Data Collected with the PurpleAir Sensor.” Atmospheric Measurement Techniques, vol. 14, no. 6, 2021, pp. 4617–4637., doi:10.5194/amt-14-4617-2021.
- Tryner, Jessica, et al. “Laboratory Evaluation of Low-Cost PurpleAir PM Monitors and in-Field Correction Using Co-Located Portable Filter Samplers.” Atmospheric Environment, vol. 220, 2020, p. 117067., doi:10.1016/j.atmosenv.2019.117067.
- Wallace, Lance, et al. “Calibration of Low-Cost PurpleAir Outdoor Monitors Using an Improved Method of Calculating PM.” Atmospheric Environment, vol. 256, 2021, p. 118432., doi:10.1016/j.atmosenv.2021.118432.
- Chicago Department of Public Health (CDPH), “Healthy Chicago 2020: Closing Our Life-Expectancy Gap 2020-2025” 2020
- Illinois Environmental Protection Agency (IEPA), Bureau of Air. Illinois Annual Air Quality Report 2019.
